Example
You can smooth a supernova spectrum using this example code.
import matplotlib.pyplot as plt
import numpy as np

from pyspecdenoise.fourier import fourier_smoothing

REDSHIFT = 0.006468

input_wave, input_flux = np.loadtxt(
    "SN2004gq_2004-12-12_07-12-00_FLWO-1.5m_FAST_CfA-Stripped.flm",
    usecols=range(2),
    unpack=True,
)

wave, smoothed_flux = fourier_smoothing(
    input_wave / (1 + REDSHIFT), input_flux / np.mean(input_flux)
)

# Plot
plt.plot(
    input_wave / (1 + REDSHIFT),
    input_flux / np.mean(input_flux),
    alpha=0.4,
    label="Input spectrum",
    color="C1",
)
plt.plot(wave, smoothed_flux, label="Smoothed spectrum", color="C0")
plt.xlim((3500, 7000))
plt.xlabel("Rest-wavelength [$\\AA$]")
plt.ylabel("Flux [arb. units]")
plt.legend()
plt.savefig("example.png", dpi=600, bbox_inches="tight")
This code will produce the following output:
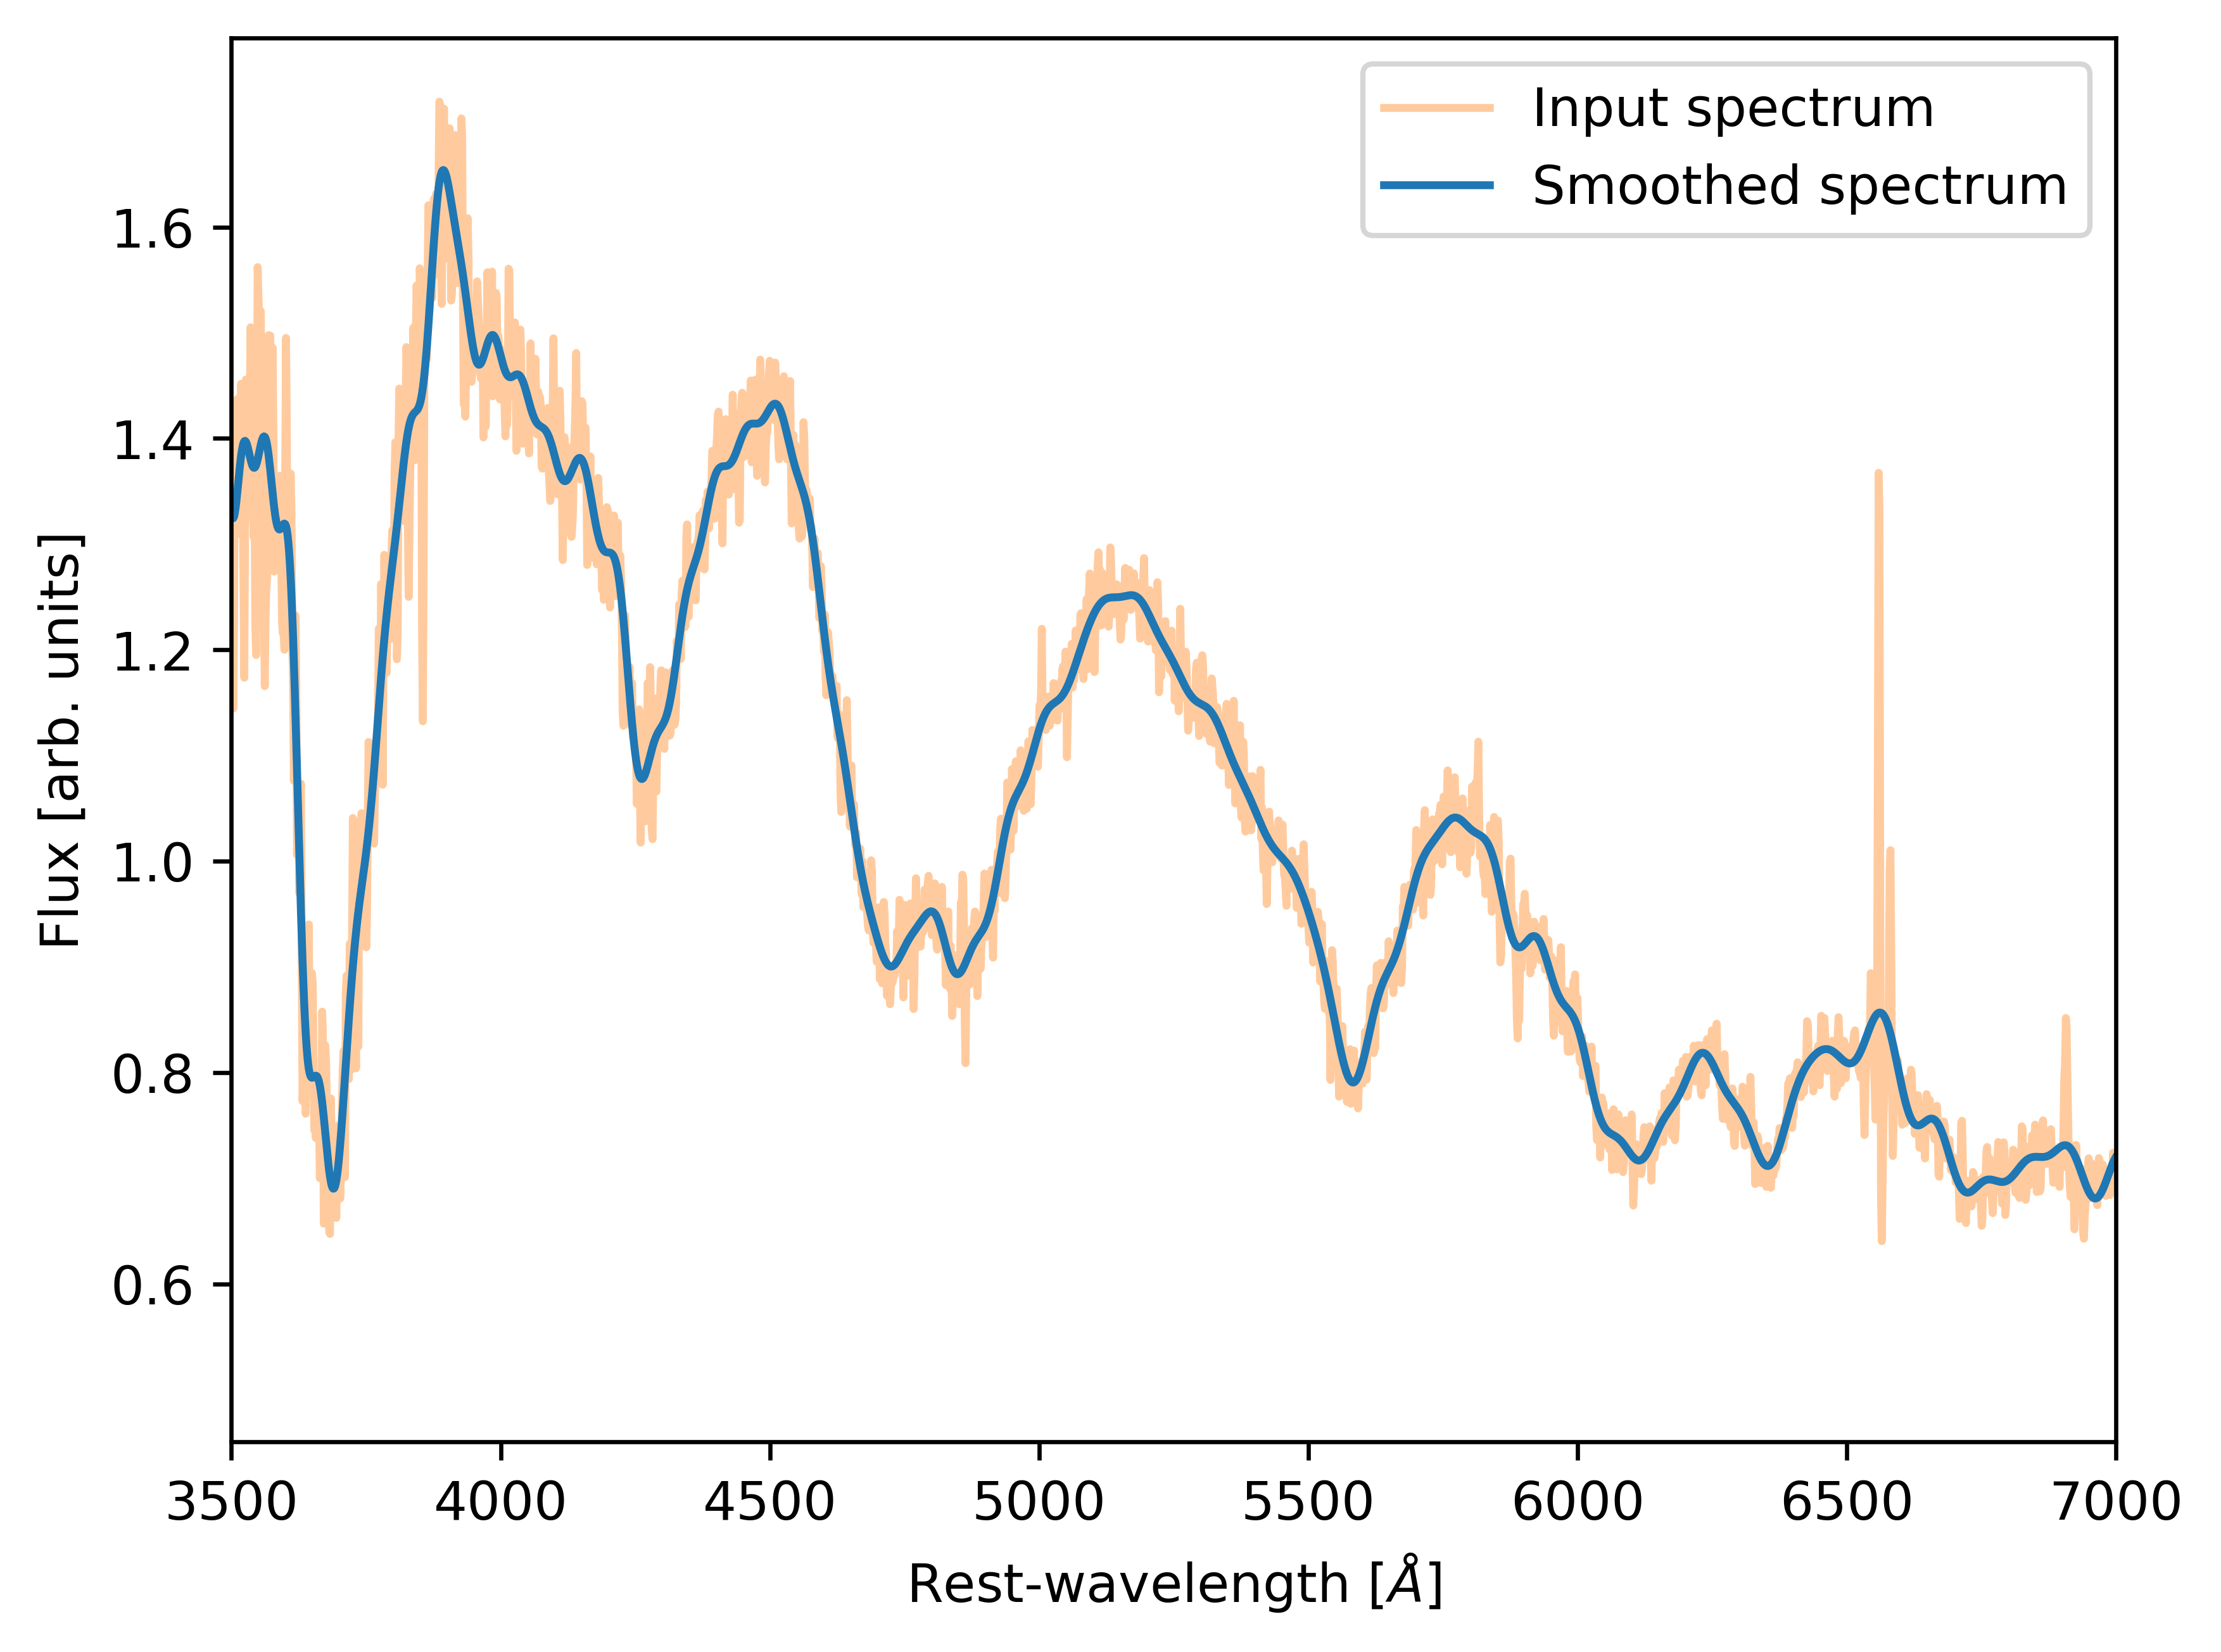
This example uses a spectrum of SN2004gq taken from WISeREP. You can obtain the spectrum on GitHub here.